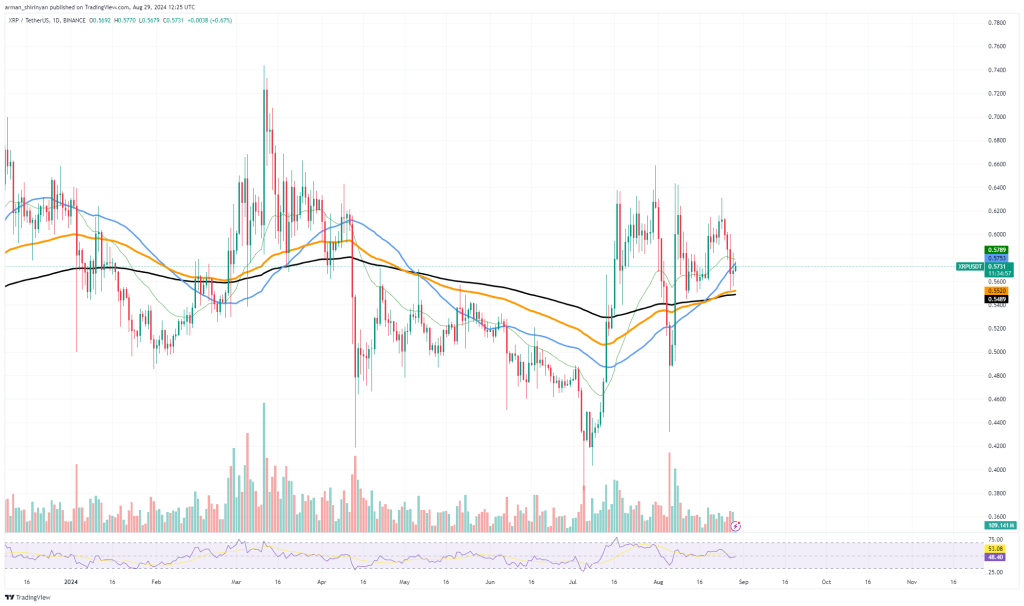
XRP recently demonstrated indications of a significant recovery, rising back to the 50-day Exponential Moving Average (EMA), following a sharp decline to an unfavorable low of $0.55. It is important that XRP bounces because it shows that the asset is regaining momentum and resisting bearish pressures that have dominated its recent price action.
The 50 EMA is an important technical indicator that is commonly used as a critical resistance or support level. It is encouraging that XRP has recovered this level since it indicates that bulls are stepping in to support the asset at critical price points. Even in the face of recent market downturns, XRP has been able to recover from its $0.55 low and test the 50 EMA once more, indicating the underlying strength of the market.

This rebound is critical for XRP as it attempts to stabilize and possibly even gain momentum once more. The fact that XRP has successfully bounced off the $0.55 level suggests that there is still a lot of buying interest in the cryptocurrency, especially as it approaches significant technical levels. If XRP can maintain its current momentum and close the gap with the 50 EMA, it could lead to new opportunities for gains and possibly even take the asset back to its previous highs.
But the market is still cautious, and XRP’s short-term future will mostly depend on its ability to stay above the 50 EMA. If the asset fails to hold this level, there could be more selling pressure, which would lead to another test of the $0.55 support level.
Solana’s strong support
Solana is facing a formidable support level in the 200-day Exponential Moving Average, which bears have historically found to be a formidable barrier to overcome. The 200 EMA, a critical benchmark for determining an asset’s long-term trajectory, has prevented Solana’s price from rising significantly thus far, preserving the asset’s consolidation.
Based on the recent price action, it seems that Solana is more likely to be experiencing a phase of consolidation than a trend reversal. The asset has been oscillating around the 200 EMA, unable to establish a sustained break above it. This pattern indicates that while Solana is moving forward, it is still lacking the momentum required to get past this substantial barrier. It is important to keep in mind that there is still a very good chance of recovery.
If Solana manages to make a big breakthrough of the 100 or 50 EMA, there may be a stronger upward push. The market might get the boost it needs from these shorter-term moving averages to eventually break above the 200 EMA.
If these levels are successfully broken, it might start a longer-lasting rally and signal a shift in the mood of the market. On the other hand, if Solana continues to struggle below the 200 EMA, it might indicate a lengthy period of sideways trading or even further declines. The 200 EMA is the crucial level to watch since it looks like the market is about to turn.
Ethereum still fine
Ethereum is suggesting a potential reversal despite the market-shattering 11% decline that occurred recently. The asset is currently trading in an ascending channel, a pattern that often signals an impending upward move. This ascending channel suggests that Ethereum is getting ready for a recovery after its recent decline. In the ascending channel technical pattern, the price oscillates between two parallel trend lines, with each higher low and higher high indicating the possibility of an ongoing upward trend.
Ethereum needs to pay attention to this pattern because it provides a calculated path for recovery even in the case of significant sell-offs. Based on movement within the channel, the asset is currently retaining its bullish structure despite the setbacks. The effective defense of the lower boundary of the ascending channel creates a situation where Ethereum might return soon.
If Ethereum can hold this support and continue trading inside the channel, it has a good chance of testing higher resistance levels, particularly those approximately at the $3,000 mark. A breakout above the upper trendline of the channel would further validate this bullish reversal and potentially lead to a longer-term rally.
Furthermore, the relative strength index (RSI) of the chart is circling the oversold region, suggesting that the selling pressure may be tapering off. This could lead to a price recovery, especially if volume growth is also occurring.


Leave a Reply