After a positive September, the price of bitcoin is seeing a possible Q4 rally. Institutional inflows and a bullish flag pattern signal strong market sentiment.
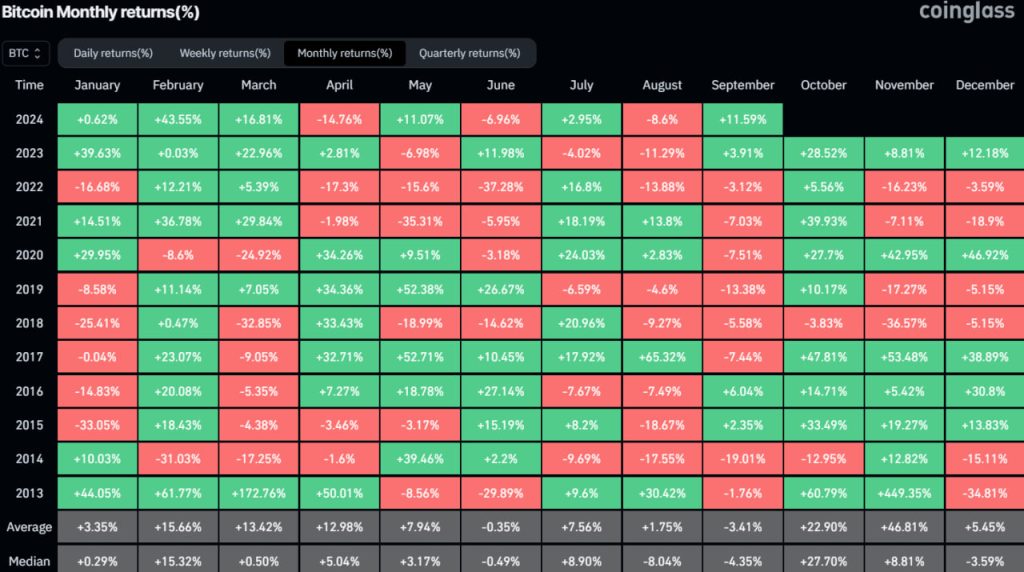
The price of bitcoin is currently trading at $65789 after a slight loss of 0.13% during Sunday’s trading. September 2024 would show about 15% growth if the monthly candle closes around the previously mentioned value. According to historical data, this month’s recovery trend is unusual, but if it does occur, it suggests possible growth in Q4.
Is Bitcoin Price Poised to Repeat Its Q4 Rally After a September Upswing
Based on data from Coinglass, the price of Bitcoin is currently trading at $65818, with a market capitalization of $1.3 trillion. A growth of 11.5%–15% would be recorded in September 2024 if the monthly candle closes at $65800.
Only three times since 2013 has Bitcoin seen a September positive trend, all of which served as preludes to the big surge to 2024. If past performance is any guide, the price of bitcoin might see a protracted upswing in the fourth quarter, possibly surpassing its all-time high of $73,750.

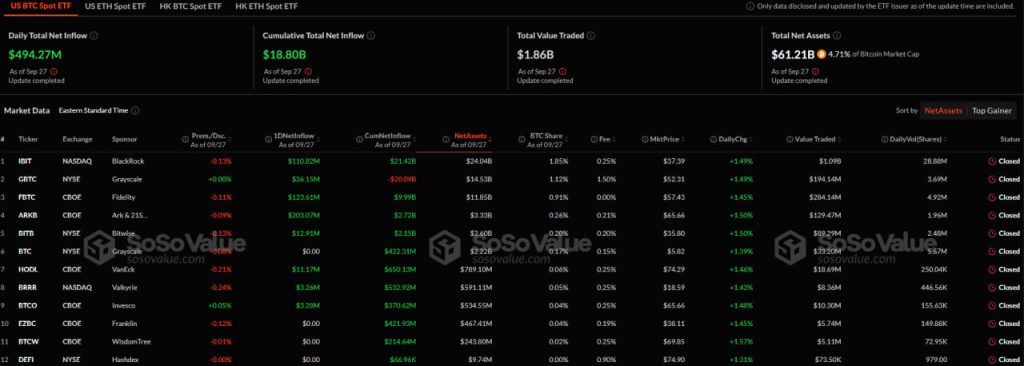
ETFs are heating up in the cryptocurrency market, with spot Bitcoin ETFs witnessing substantial inflows last week. On Friday alone, Bitcoin recorded a remarkable $494.4 million in net inflows, according to Sosolvaue data.
A weekly inflow of +$1.1B was observed in the spot Bitcoin ETFs over the course of the weeks, suggesting an increase in institutional interest. Additionally, the spot ETH ETH reported a weekly data of $85 million. This influx is encouraging for the market and might be a sign of growing trust in digital assets.

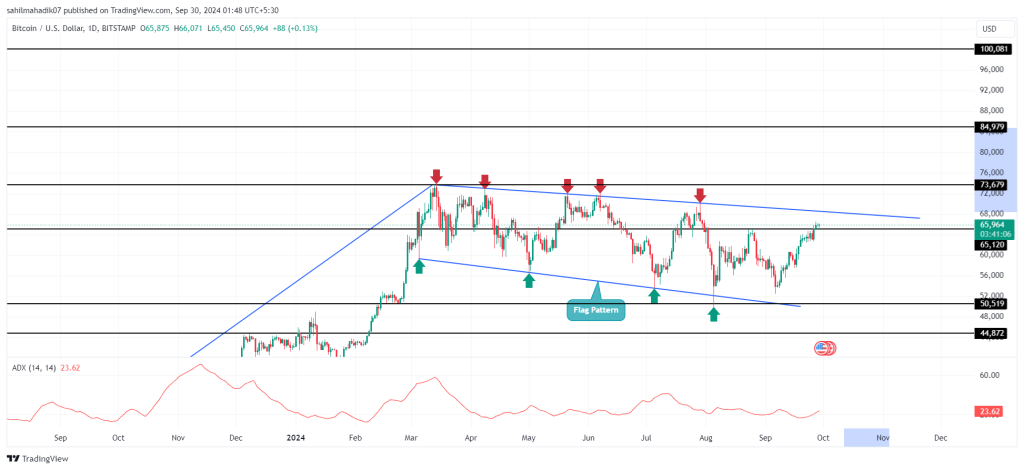
BTC Eyes 25% Rally as Bull Flag Pattern Signals Breakout
This week, the price prediction for Bitcoin saw a significant increase of 5%, from $60800 to $65910. The price extended in a V-shaped pattern on the daily chart as a result of this upswing, indicating a sharp change in market sentiment.
The price of bitcoin increased 3% as a result of persistent buying before testing the bull-flag pattern’s resistance trendline. In theory, the chart pattern initiates a brief countertrend movement and then produces a false breakout.
The bullish momentum will pick up speed with an upside breakout, propelling a rally to $85000, or 25% potential growth.

Conversely, should the overhead supply from the resistance trendline hold, the price of Bitcoin may initiate yet another reversal.


Leave a Reply