Even though Bitcoin hit a new all-time high of $73,880 earlier in 2024, it would not rise above its inflation-adjusted 2021 value if it were to fall by 2025.

Right now, the price of Bitcoin (BTC) is only 14% below its peak, and with the right circumstances, targets of over $80,000 in the upcoming weeks have been set.
However, taking inflation into account, a new all-time high (ATH) of roughly $100,000 might not be as remarkable a feat as initially thought.
Adjusting Bitcoin price for inflation (2021 vs. 2024)
Luke Broyles, a Bitcoin analyst, argues that BTC crossing the elusive $100,000 mark will “barely” match BTC’s buying value in 2021. In an X post, Broyles highlights that, if adjusted for inflation, the ATH price from 2021 will be $83,000 at the moment.
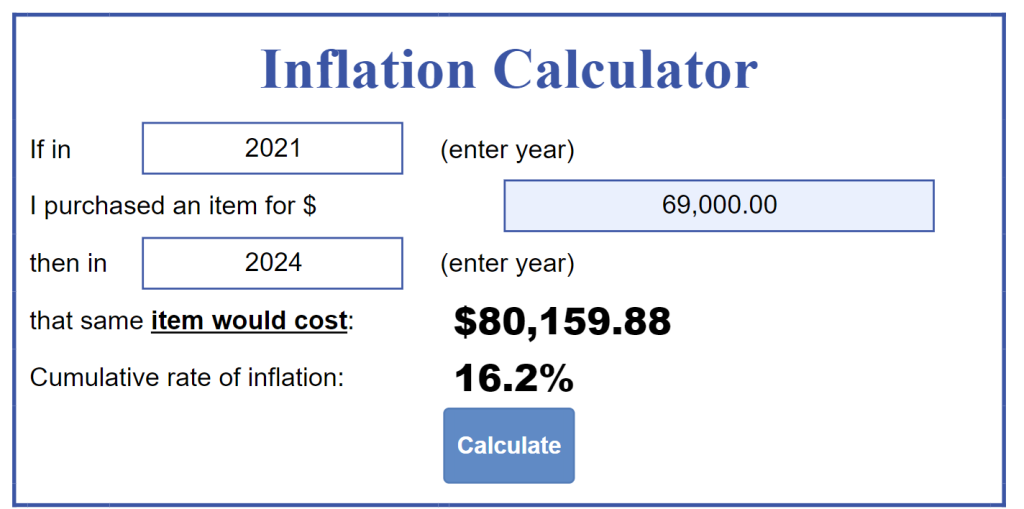
Data derived via the U.S. inflation calculator suggests this is fairly accurate. An item bought around $69,000 (assuming people bought BTC at the 2021 top) would currently be priced at $80,159.88, with a current cumulative rate of inflation at 16.2%.

The US inflation calculator measures the dollar’s buying power over a period of time. Keeping that in mind, Broyles adds,
“By the time we have the next round of printing in the next 6-18 months, it will be $95,000. $100,000 nominal BTC price in 2025 is (quite possibly) barely getting us to 2021 levels.”
Bitcoin eyes $65K for a higher high
September has historically been a bearish month, but over the last 14 days, the price of bitcoin has increased by 18%. Before going through a bullish trend shift, Bitcoin is currently going through its last test.

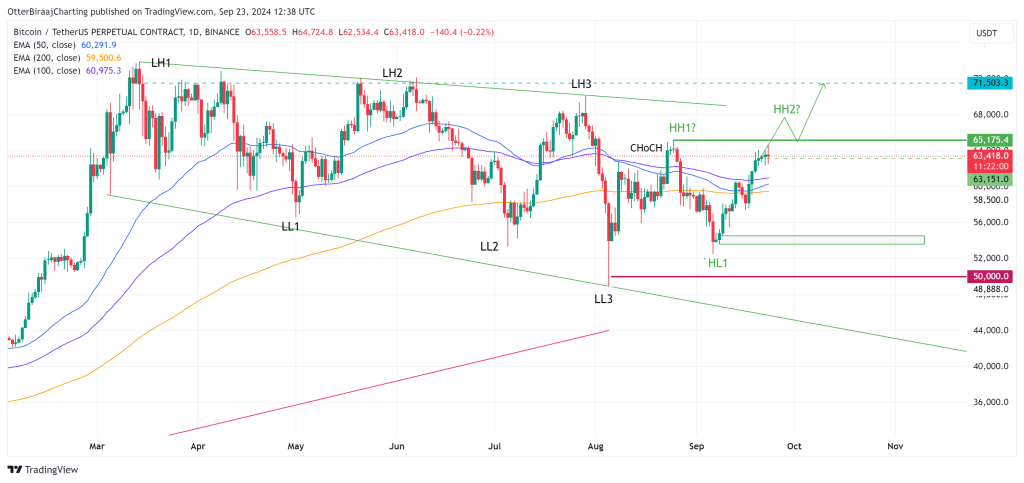
Since March 2024, Bitcoin has been exhibiting lower highs and lower lows on the one-day chart, as can be seen in the above chart.
The current goal for Bitcoin is to cross over the supply/resistance zone at $65,000, which will cause a shift in the market’s perception of itself or ChoCH.
The long-term downtrend should shift and a higher high, higher low pattern will emerge, resulting in a new uptrend, if $65K can be turned into support. Around $71,500 is where immediate resistance above $65,000 is located.
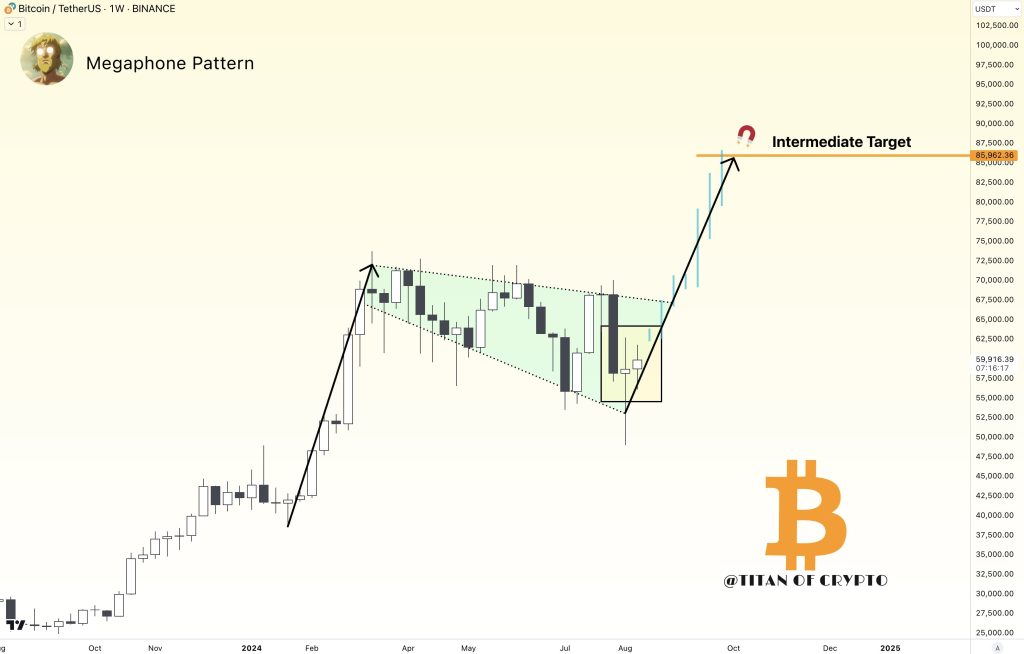
Cointelegraph revealed last month that there may be a September breakout, which could lead to a rally toward $86,000.
Thus far, price action has followed the expected path, and over the next few weeks, a 34.37% upswing is anticipated according to the “megaphone” pattern that is still in place.

Similar higher highs and lower lows are present in the megaphone pattern, which supports either a macro top or macro bottom. As of right now, the price is rising, indicating that Bitcoin is getting closer to verifying a bottom and possibly heading higher.
This article does not contain investment advice or recommendations. Every investment and trading move involves risk, and readers should conduct their own research when making a decision.


Leave a Reply